Telematics data, speed, braking, and acceleration tell you something about how someone drives. It doesn’t tell you whether they hold their lane, how they respond to pedestrians, or whether they make dangerous manoeuvres in complex traffic. This project was built around that gap: building a driver scoring system that actually sees what the driver is doing, not just what the vehicle’s sensors record.
Challenges Identified:
- Limited visibility from telemetry, only systems: Speed, braking, and acceleration data doesn’t capture lane discipline, wrong direction driving, or how a driver responds to the environment around them. Fleets were scoring drivers on an incomplete picture.
- Manual monitoring of video data: CCTV and dashcam footage existed across most fleets, but reviewing it at scale was impractical. Most of it was never watched unless an incident occurred, which meant the safety signals it contained were invisible in normal operations.
- Difficulty processing unstructured data: Video is inherently unstructured. Extracting meaningful driving behaviour signals from raw footage, without a human watching each clip, required computer vision models that could identify specific events reliably across varying conditions.
- Fragmented data sources: Roadside cameras, in-vehicle dashcams, and telemetry devices fed into separate systems with no unified view. Fleet managers couldn’t assess a driver’s full behaviour profile in one place.
Solution Features:
The platform ingests multiple sources of video and telemetry data and processes it automatically to generate driver behaviour scores:
- Multi-Source Data Ingestion: Video feeds from CCTV and dashcam systems, alongside telemetry signals, are collected continuously and stored in cloud-based object storage. The ingestion layer is built to handle multiple camera formats and telemetry protocols.
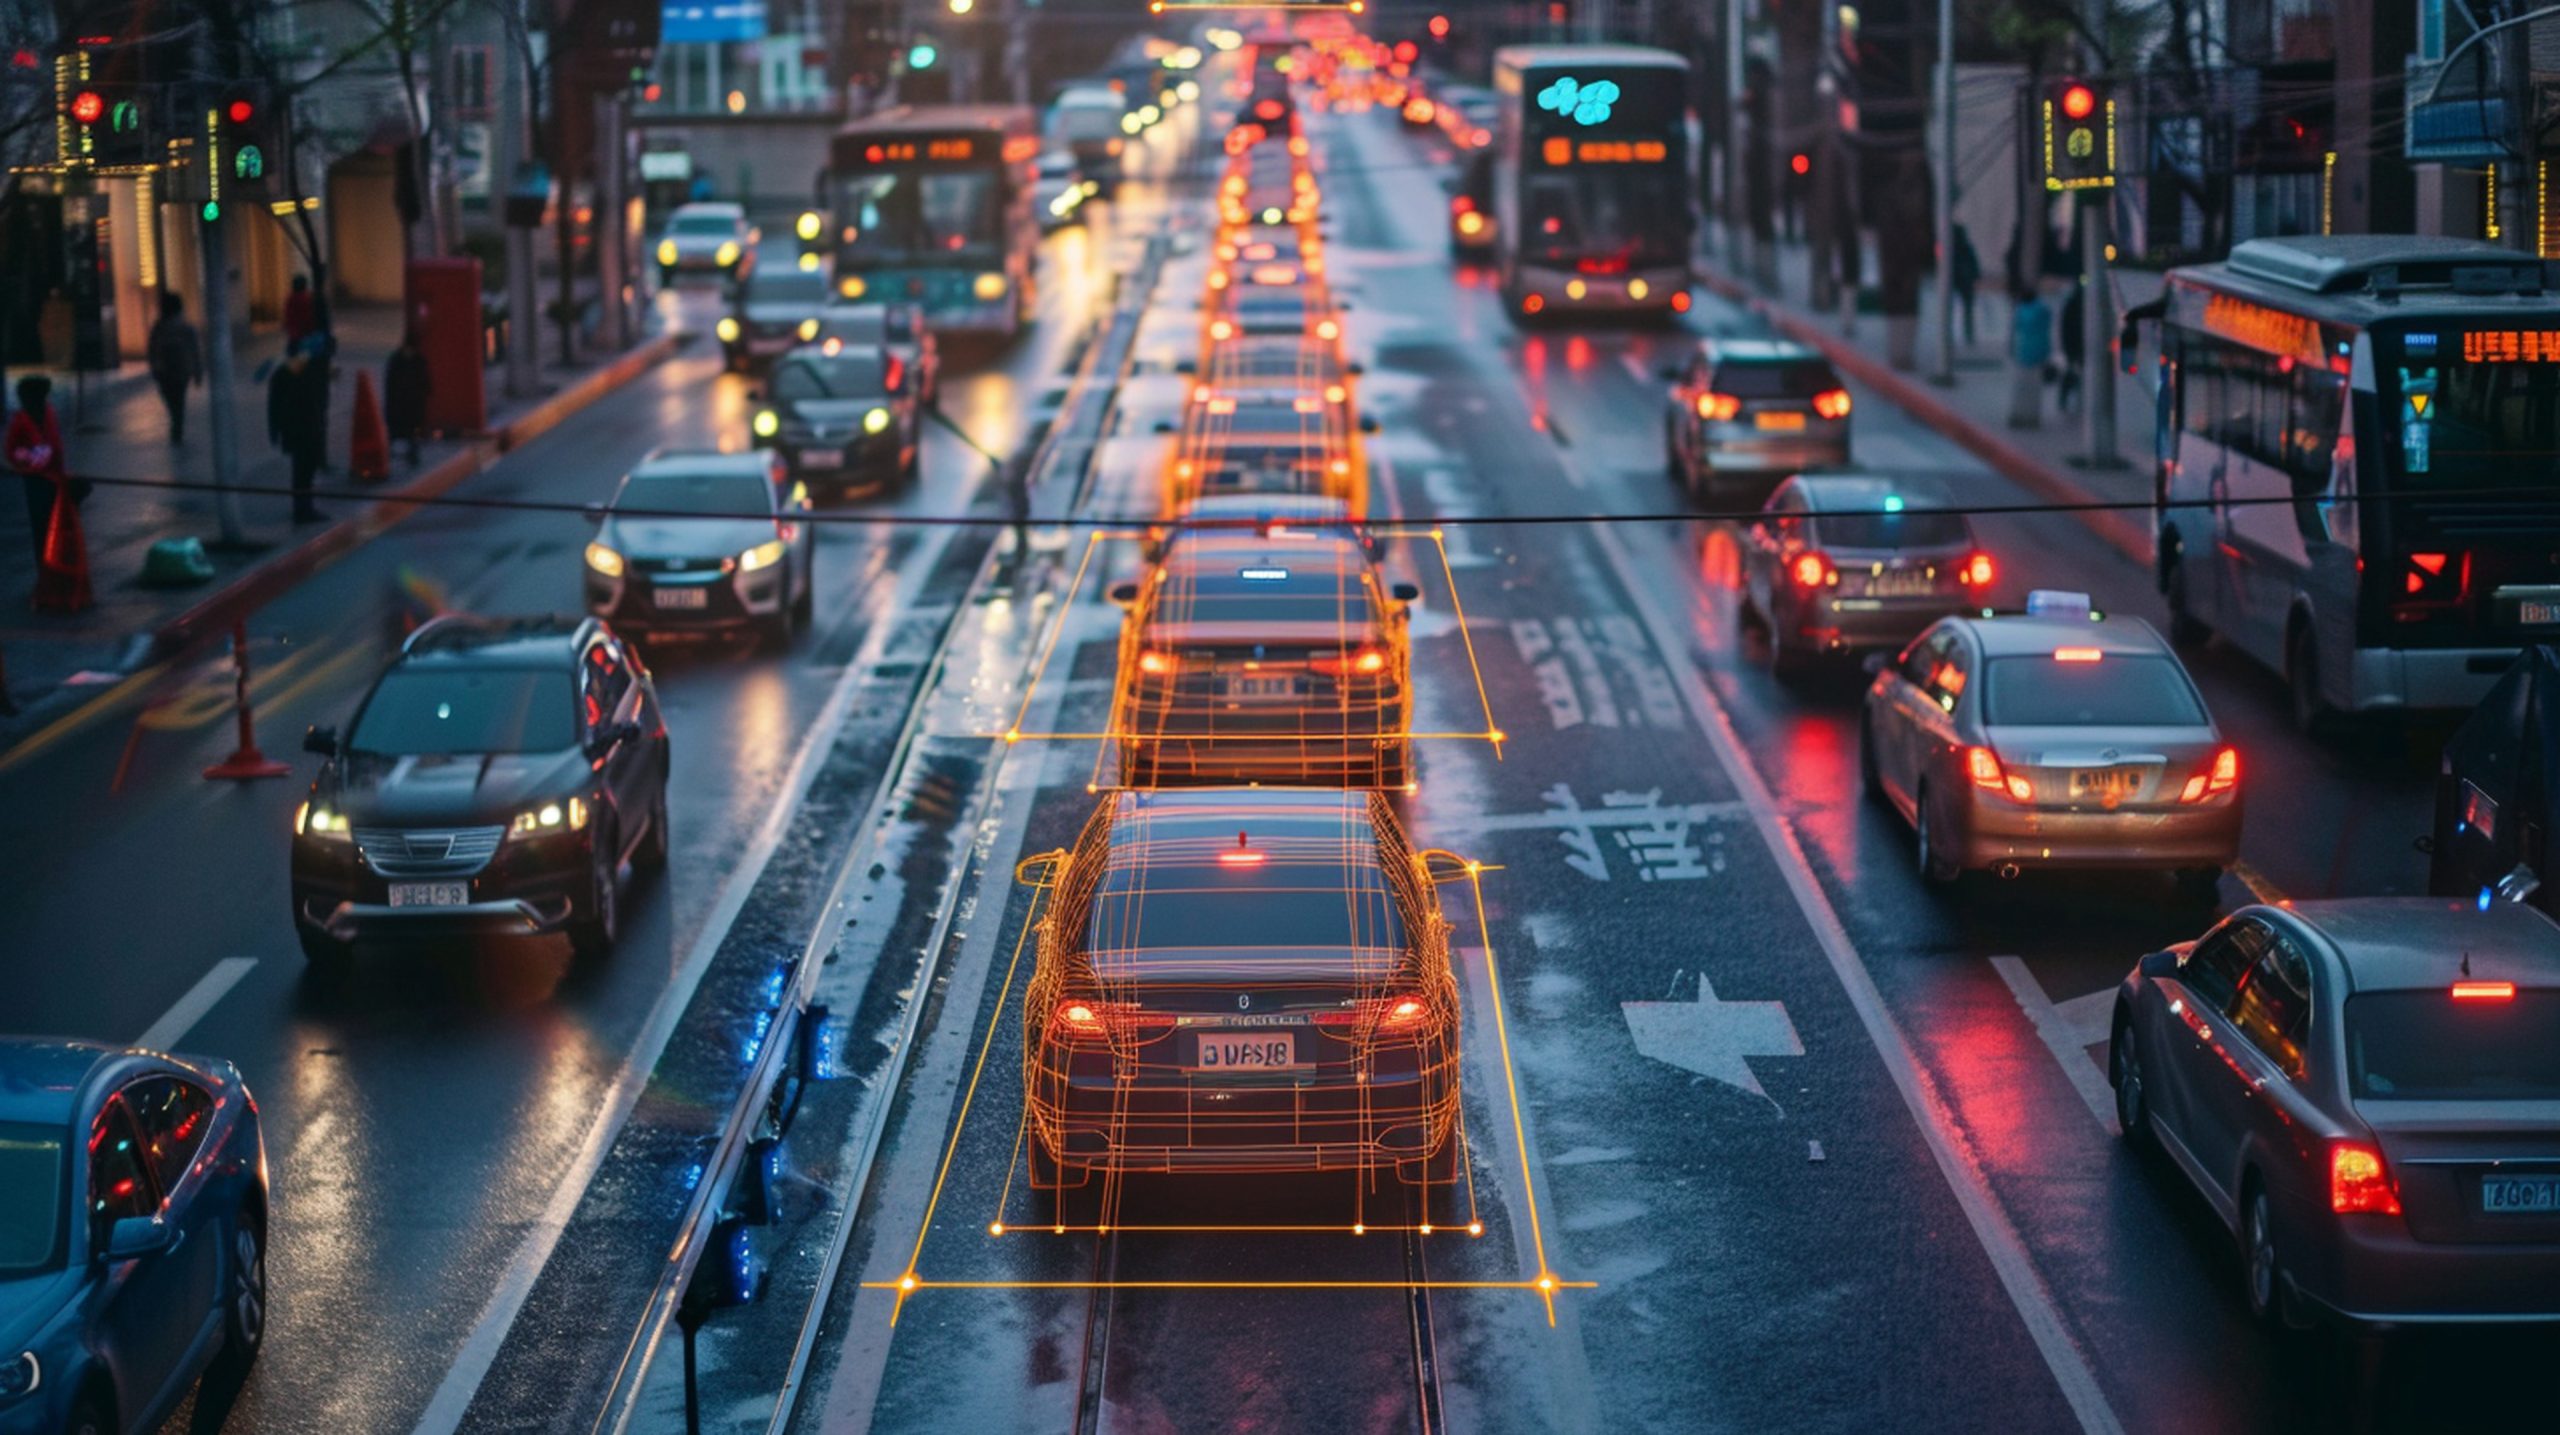
- AI-Powered Video Analysis: Computer vision models process video frame by frame, detecting specific driving behaviours: lane discipline violations, wrong direction driving, vehicle trajectory patterns. These are the behaviours that telemetry misses entirely.
- Advanced Object Detection and Segmentation: YOLOv8 handles real-time object detection, identifying vehicles, lane markings, and road elements in each frame. Semantic segmentation models handle lane detection specifically, which is critical for lane discipline scoring.
- Motion and Behaviour Analysis: Optical flow (Farneback method) tracks how vehicles move across frames. This allows the system to detect trajectory anomalies, a vehicle drifting toward a boundary, or making an abrupt direction change, without requiring a human to watch the footage.
- Driver Behaviour Scoring Engine: Extracted behavioural events are stored in MongoDB and fed into a scoring model that produces driver profiles. Fleet managers can query by driver, route, time period, or violation type. The scores weight events by frequency, severity, and context, a hard brake in heavy rain is treated differently from the same action on an empty road.
Advantages:
- Comprehensive Behaviour Assessment: Combining video analysis with telemetry data gives a complete picture of driving behaviour, not just what the sensors captured, but what the camera actually saw.
- Automated Violation Detection: The models identify lane indiscipline, wrong-direction driving, and trajectory anomalies automatically. No human review required for standard events; high-severity cases are flagged for manual follow-up.
- Scalable Video Processing: Cloud-based processing with Python multiprocessing handles high volumes of footage without proportionally more infrastructure. The system scales with fleet size.
- Improved Safety Monitoring: Fleet managers now have a data-driven basis for coaching conversations. Drivers with clean telemetry records but problematic video patterns are identifiable for the first time.
- Actionable Driver Scoring: Scores are specific enough to drive real decisions, who needs additional training, which routes carry higher risk, where coaching should focus. That’s different from a generic safety rating that sits in a dashboard unread.
Conclusion:
The platform changed what fleet managers can see. Before it, a driver’s safety profile was limited to what telemetry captured, which is useful but partial. With computer vision, optical flow, and multi-source data ingestion running together on a cloud, native stack, the system surfaces the behaviours that actually cause incidents: the lane drift, the wrong direction approach, the near-miss that never triggered a sensor event. That visibility is what makes the scoring meaningful and the coaching conversations worth having.